Executive summary
- Top practical picks: NVIDIA (NVDA) for dominant AI GPU platform; AMD (AMD) for accelerating data-center GPUs and CPUs; TSMC (TSM) for foundry exposure to AI demand; Micron (MU) for AI memory/HBM; Broadcom (AVGO) and Intel (INTC) for networking and CPU/accelerator plays.
- Key sector metric: AI/data-center GPU revenue is concentrated: NVIDIA reported $46.7B revenue in Q2 FY2026, driven by data center Blackwell shipments and a 72.7% non-GAAP gross margin.
- Risk-reward: best semiconductor AI chip stocks 2025 thesis depends on sustained AI server buildouts, HBM supply, and foundry capacity; execution failures, export restrictions, or memory cycles create rapid downside.
- Tactical verdict: overweight NVIDIA for pure-play AI acceleration, pair with TSMC or Micron to hedge supply-chain exposure; allocate smaller tactical positions to AMD and Broadcom based on product cycles and gross-margin resilience.
Summary fundamentals
Narrow selection statistics for headline AI chipmakers (latest reported quarter):
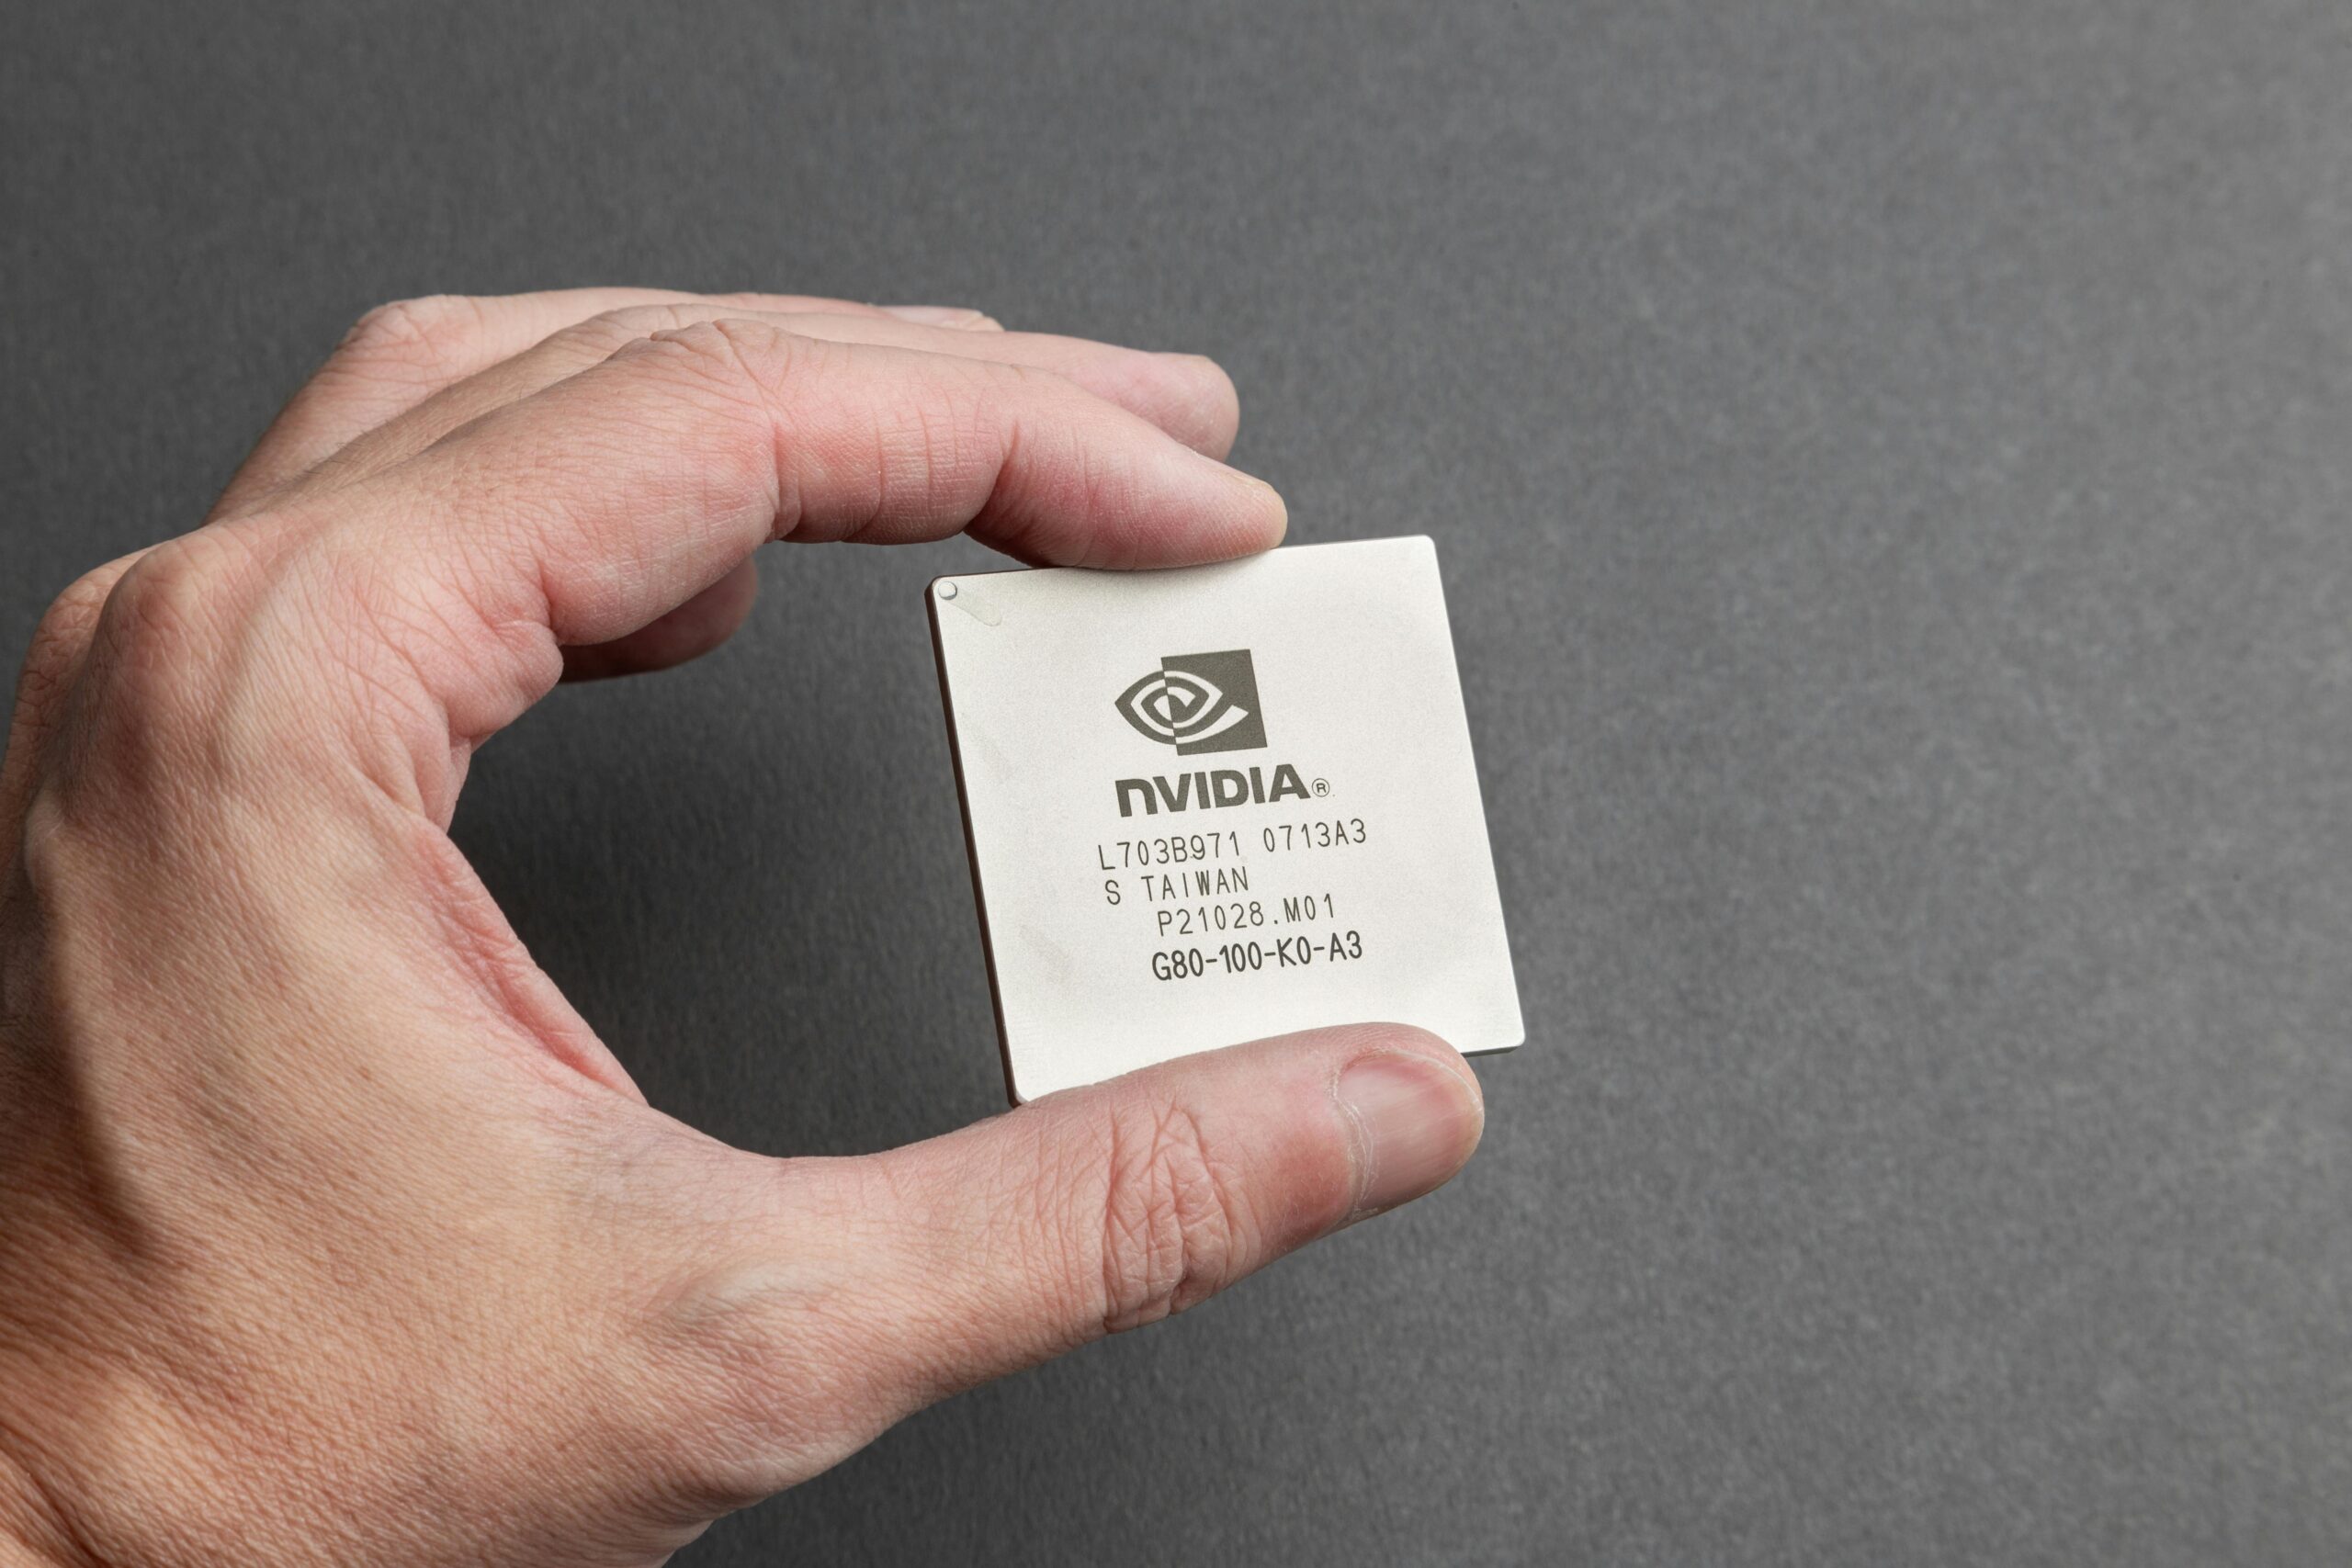
- NVIDIA (NVDA): revenue $46.7 billion (Q2 FY2026), YoY +56%; GAAP EPS $1.08; non-GAAP gross margin 72.7%; debt-to-equity low relative to market-cap; market cap ~ $4.4 trillion.
- AMD (AMD): revenue $7.7 billion (Q2 2025), YoY +32%; diluted EPS $0.54; gross margin 40% GAAP (43% non-GAAP); total debt ~$3.22B, shareholders’ equity ~$59.67B → debt/equity ≈ 0.054; market cap ≈ $260B.
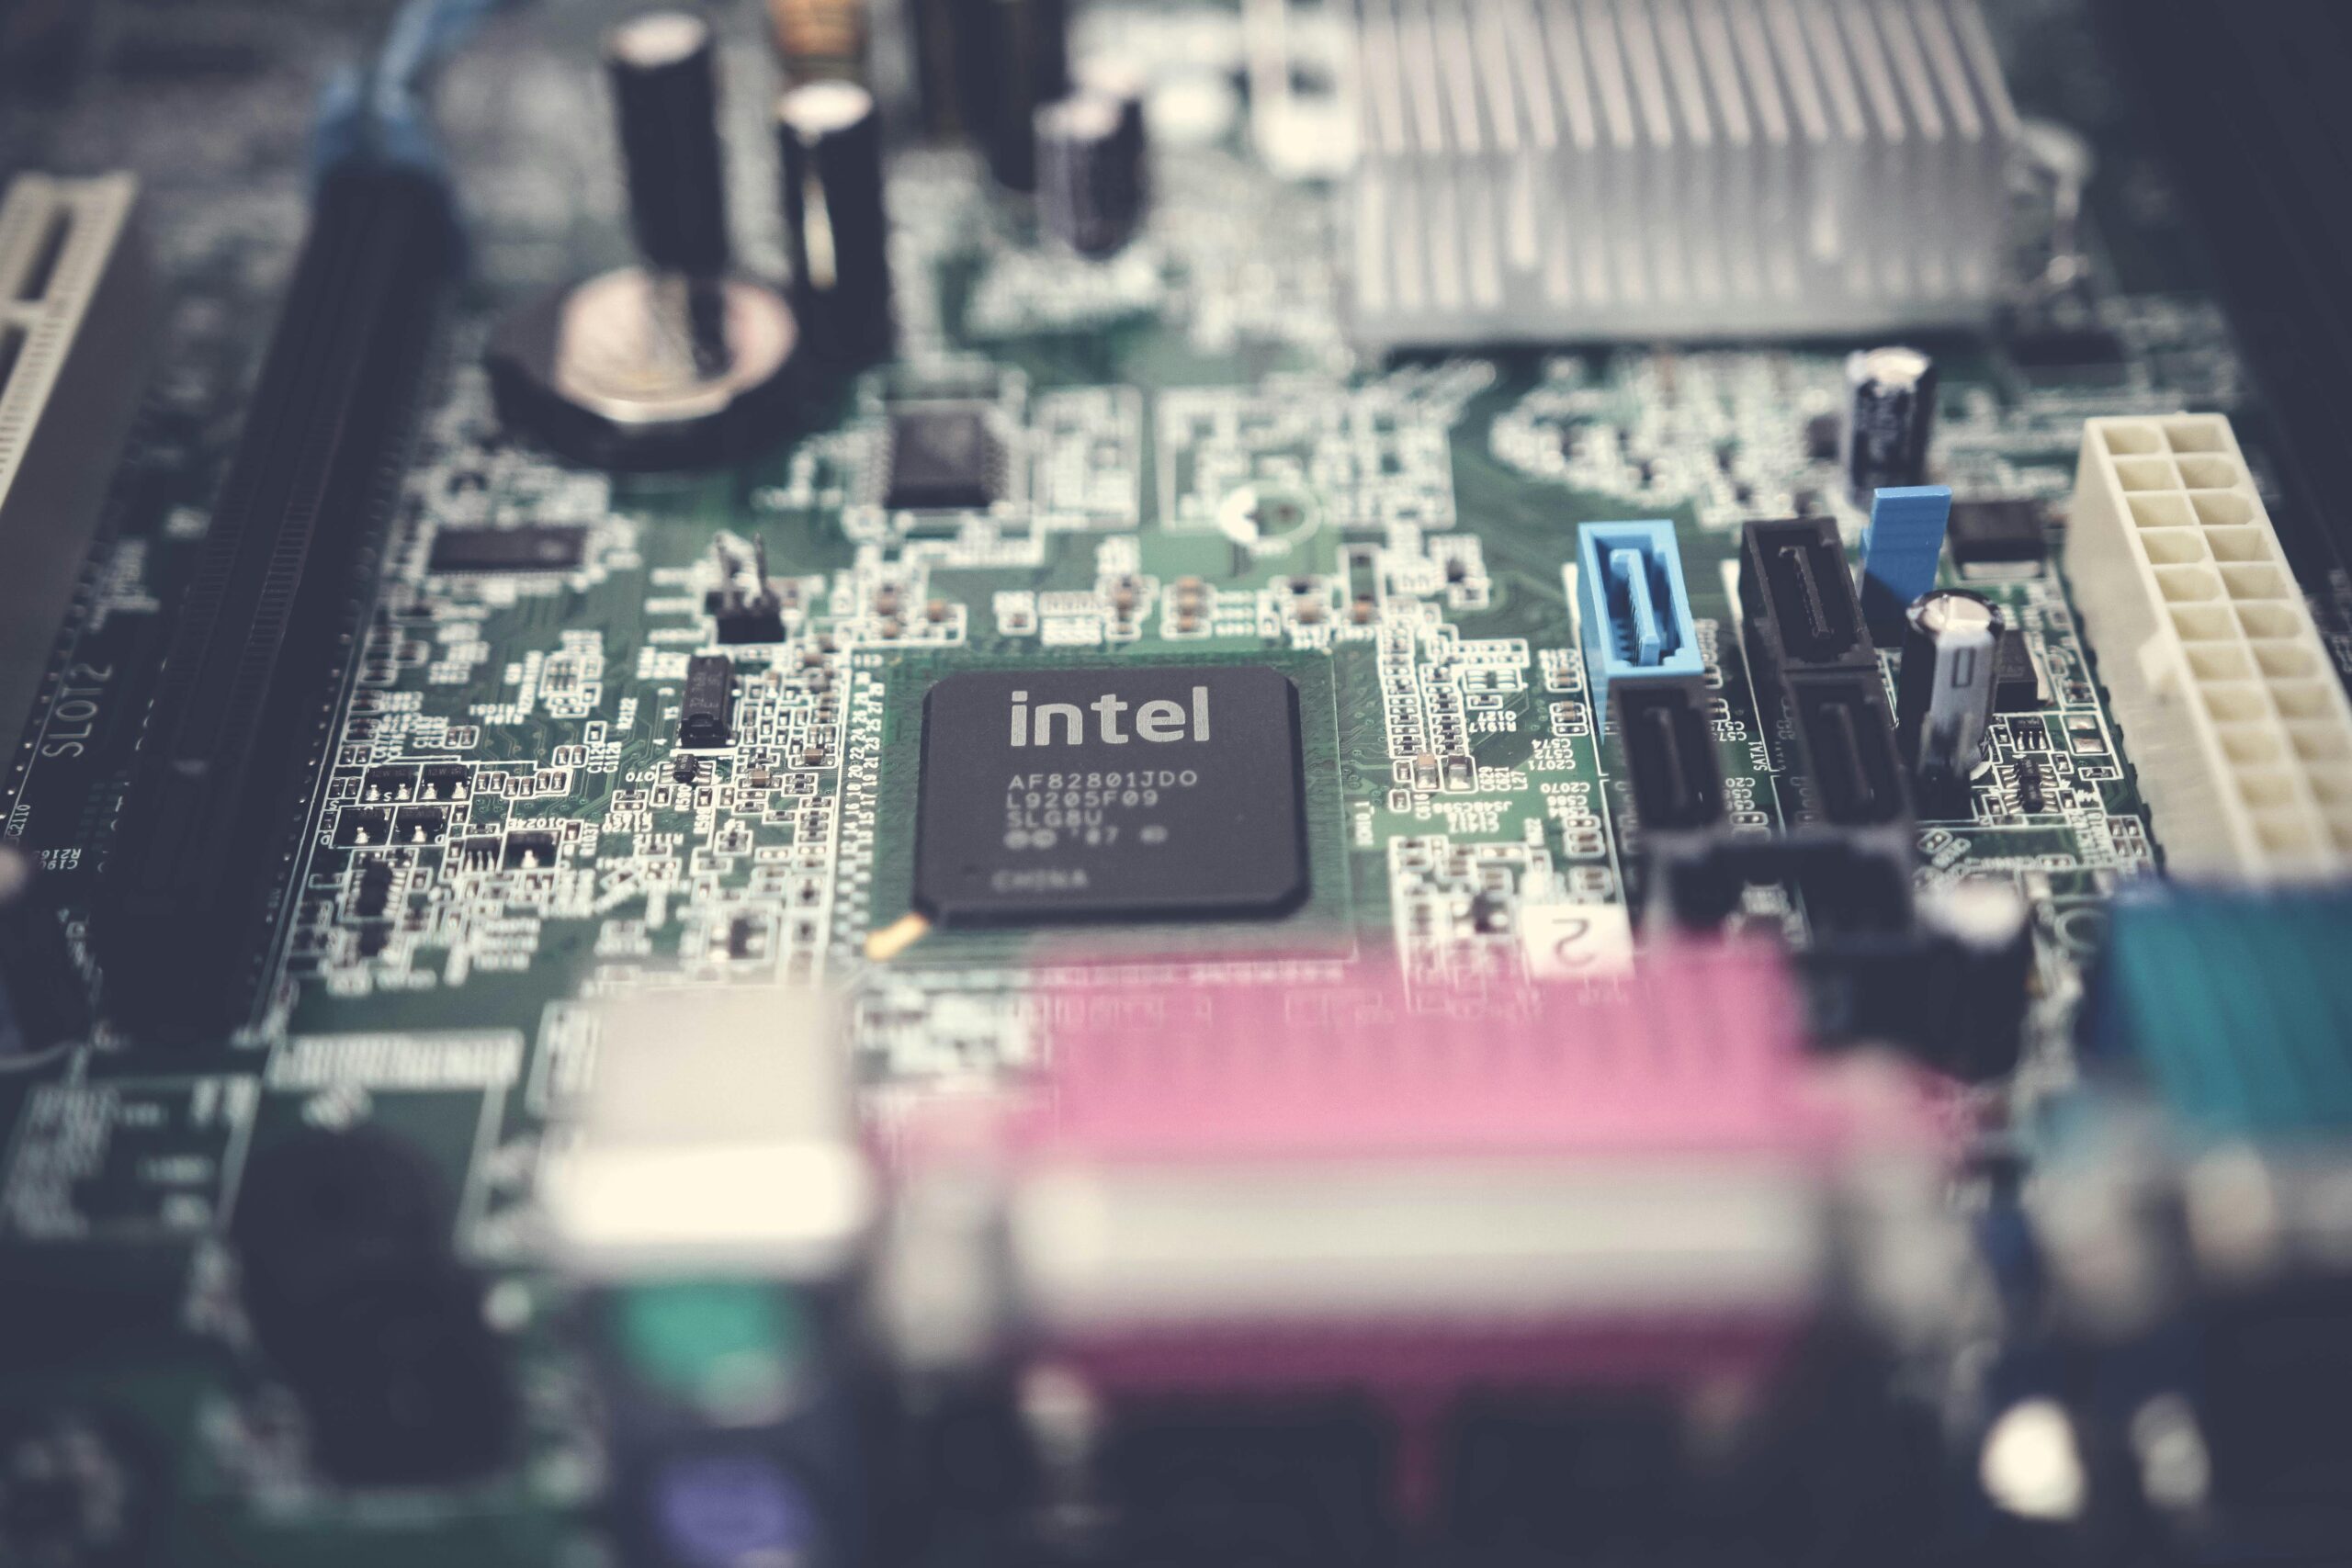
- Intel (INTC): revenue $12.9 billion (Q2 2025), YoY flat; GAAP EPS −$0.67; non-GAAP gross margin ~29.7%; material restructuring and impairment charges impacted EPS; market cap ≈ $160B.
- Broadcom (AVGO): revenue $15.0 billion (Q2 FY2025), YoY +20%; GAAP net income $4.965 billion; long-term debt ~$62.8B; stockholders’ equity ~$73.3B → debt/equity ≈ 0.88; market cap ≈ $1.56T.
- TSMC (TSM): net revenue $30.07 billion (Q2 2025), YoY +44%; gross margin 58.6%; strong operating margin and foundry order book; market cap ≈ $1.42T.
- Micron (MU): revenue $8.05 billion (Q2 FY2025), YoY +38%; GAAP net income $1.58 billion; gross margin and HBM revenue share surging; market cap ≈ $183B.
All figures cited from company releases and investor filings.
Detailed fundamental analysis
Revenue trends and concentration
AI acceleration demand is highly concentrated among a few product lines. NVIDIA’s data-center Blackwell platform accounts for the overwhelming majority of its recent revenue surge; Q2 FY2026 Data Center revenue was $41.1 billion and represented the primary top-line driver. TSMC’s foundry revenue growth mirrors that server/GPU demand, with reported Q2 net revenue $30.07 billion. Micron’s advanced memory (HBM family) is scaling rapidly, with management citing HBM as a material portion of enterprise revenue growth. AMD’s server GPU and EPYC CPU wins are contributing to record quarterly revenue but remain second to NVIDIA in pure AI GPU market share.
Concentration risk: a single OEM’s production cadence or a single export restriction can materially change quarterly revenue across this set. NVIDIA’s public statements about H20 export licensing illustrate geopolitical exposure.
Margin drivers
AI chip gross margins are structural outliers. NVIDIA reported non-GAAP gross margin of 72.7% in Q2 FY2026, enabled by software and rack-scale licensing, high ASPs for Blackwell, and IP-led differentiation. TSMC gross margin remains high (58.6%) due to advanced-node pricing power and capacity tightness. Memory (Micron) gross margins expanded with HBM pricing, with Micron reporting gross margins in the mid-40s to low-50s in the most recent cycle. Broadcom’s consolidated EBITDA reflects software and high-margin networking ASICs, while Intel’s margins are compressed by restructuring and foundry investment. Monitor ASPs, inventory, and mix between chips, software, and services.
Balance-sheet strength and capital intensity
Foundry and memory companies carry heavy capex burdens. TSMC’s capex profile remains intensive but is supported by long-term foundry contracts. Micron’s capacity expansion and CHIPS Act funds materially de-risk capital plans. Broadcom shows high leverage from M&A but very strong cash generation. NVIDIA generates substantial free cash flow and is actively returning capital via buybacks. Intel is undergoing expensive restructuring and has material one-off charges that affect reported leverage metrics; it has also attracted strategic investments. Track capex, R&D intensity, and external funding sources (subsidies, partnerships) as they change financial flexibility.
Valuation multiples
Sector multiples vary by business model:
- Pure-play GPU leader premium: NVIDIA trades at the highest multiples, priced for growth and platform dominance.
- Foundry and memory: TSMC and Micron trade on structural demand for HBM and capacity, with multiples reflecting capital intensity.
- Diversified chipmakers: Broadcom and Qualcomm are valued for software/firmware attach and networking/IP margins. Intel and AMD trade as turnaround/growth stories respectively. Use EV/Revenue for cross-company comparisons and EV/EBITDA where earnings are stable.
Momentum & technical snapshot (representative leader: NVIDIA)
- RSI(14): 58.04 – neutral-constructive.
- MACD status: MACD above signal line, modestly positive indicating short-term bullish bias.
- 50-day SMA vs 200-day SMA: 50d SMA ≈ $176.75; 200d SMA ≈ $142.04; price trading above both averages indicating medium-term uptrend.
- 1-month return vs Nasdaq Composite: NVDA 1-month price return ~+10.6% versus Nasdaq Composite ~+5.3% (1-month), NVDA outperformed the index over the last month.
- Average daily dollar volume: 30-day average volume ≈ 186.4M shares; at a ~$181 price this implies average daily dollar volume ≈ $33.8 billion.
Interpretation: technicals for NVIDIA show constructive momentum but with high dollar liquidity that can amplify intraday moves.
Peer comparison
Select peers and headline metrics for investor selection:
- Advanced Micro Devices (AMD): revenue $7.7B Q2 2025, gross margin 40% GAAP, debt-to-equity ≈ 0.05, forward P/E depressed by one-time items but supported by server GPU traction.
- Broadcom Inc. (AVGO): revenue $15.0B Q2 FY2025, gross margins and adjusted EBITDA high; debt/equity ≈ 0.88 reflecting prior M&A; forward P/E lower than pure-growth GPU peers due to software/narrower growth.
- TSMC (TSM): net revenue $30.07B Q2 2025, gross margin 58.6%, essential foundry partner with capacity-linked pricing power; forward P/E depends on node-cycle visibility.
Takeaway: NVDA leads growth and margins, AMD is second-tier GPU + CPU exposure, Broadcom offers higher margin stability with leverage risk, TSMC and Micron provide supply-chain plays with their own cyclical drivers.
Latest earnings highlights & management guidance
- NVIDIA: “Revenue $46.7 billion, Blackwell delivering generational performance.”
- AMD: “Record second-quarter revenue $7.7 billion, driven by EPYC, client and gaming strength.”
- Intel: “Q2 revenue $12.9 billion; reported one-time restructuring/impairment charges leading to EPS impact.”
- TSMC: “Q2 net revenue $30.07 billion and continued demand for advanced nodes.”
- Micron: “Q2 revenue $8.05 billion; HBM demand and memory pricing drove margin expansion.”
Each quote is a paraphrase of company release headlines and guidance language.
Strategic moves, catalysts & risks
Strategic catalysts
- NVIDIA: platform software, rack-scale (NVLink/Blackwell), and ecosystem wins (DGX Cloud, enterprise OEM adoption) are primary re-rating catalysts if supply follows demand.
- AMD: scaling MI-series GPUs and EPYC CPU adoption in cloud providers; partnership or customer wins could accelerate valuation re-rating.
- TSMC: capacity ramp for advanced nodes and foundry pricing power; wafer allocation to HBM and GPU customers is a structural tailwind.
- Micron: HBM share gains and pricing environment; CHIPS Act support improves capex financing.
Material risks
- Geopolitical/export controls: restrictions on shipments to China or licensing (example: NVIDIA H20 China license issues) can abruptly remove demand or force inventory adjustments.
- Memory cyclicality: Micron and memory-dependent suppliers face sharp tails from price shifts.
- Foundry capacity: TSMC allocation decisions and node timing bottlenecks can bottleneck GPU supply and delay revenue recognition for GPU OEMs.
- Execution and capital intensity: Intel’s restructuring shows how one-time charges, capex overruns, or missed node transitions materially compress multiples.
All above items pulled from earnings releases, SEC filings, and major press coverage.
Valuation & scenario analysis
Approach: use simple EV/Revenue and EV/EBITDA bands applied to individual names and then synthesize sector allocation rules. Assumptions reflect 2026 revenue run-rate and varying levels of AI TAM capture.
- NVIDIA (NVDA)
- Conservative: EV/Revenue 12× (assumes Blackwell growth stalls) → implied downside to current pricing.
- Base: EV/Revenue 22× (current market pricing for platform dominance) → fair-value range consistent with market cap near current levels.
- Optimistic: EV/Revenue 35× (dominant platform + software monetization + higher ASPs) → material upside but requires sustained Blackwell ASP growth and supply.
- AMD
- Conservative: 4–6× EV/Revenue (cyclical GPU adoption risk).
- Base: 8–12× EV/Revenue if MI-series and EPYC scale with margin expansion.
- TSMC
- Conservative: 3–4× EV/Revenue (capital intensity priced).
- Base: 5–7× EV/Revenue if foundry pricing remains strong for advanced nodes.
- Micron
- Conservative: EV/Revenue 1–2× (memory cyclicality).
- Base/Optimistic: 2–4× EV/Revenue if HBM demand maintains premium pricing and capacity utilization.
Investor takeaway: assign higher multiples to companies with structural software/IP and sticky revenue (NVIDIA, Broadcom) and lower multiples to capital-intensive foundry/memory positions unless visibility on sustained pricing exists.
Trading checklist & signals
Momentum traders (short to medium-term)
- Entry triggers: NVDA example – buy on daily close above 50-day SMA with RSI between 50–70 and MACD confirming positive crossover.
- Exit/stop: initial stop 6–10% below entry; move to trailing stop once position is +10% to protect gains.
- Sizing: limit single-name exposure to 2–4% of liquid trading capital for high-volatility AI chip names.
Longer-term investors (value / thematic allocation)
- Core criteria before establishing >1% position: (1) multi-quarter revenue visibility from data center bookings or foundry demand, (2) improving gross margins and FCF generation, (3) manageable debt profile or committed external funding.
- Position sizing: 0.5–2% of long-term equity allocation per name for diversified exposure across GPU, foundry, and memory plays.
- Re-evaluate on triggers: material change in government export policy, a 20% miss in two consecutive quarters, or a sustained memory price collapse.


